Capture HTTP & HTTPS traffic
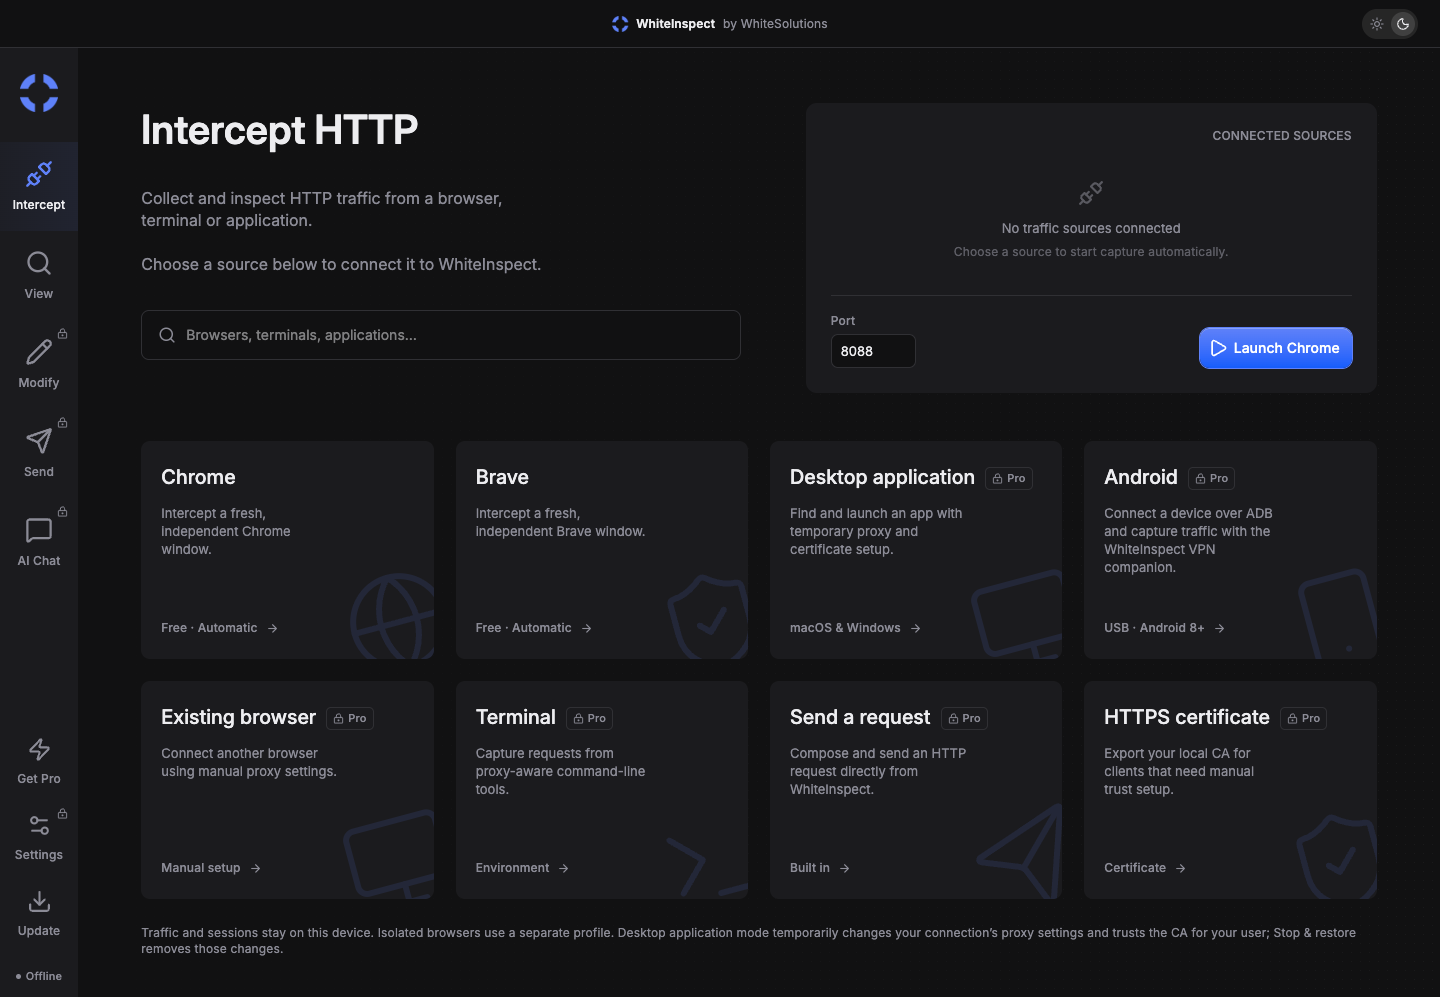
Launch an isolated Chrome or Brave window, connect a proxy-aware client, or choose an Android device. Keep your capture focused on the source you want to understand.
BrowserApplicationAndroidTerminal
 WhiteInspect by WhiteSolutions
Capture HTTP & HTTPS traffic, inspect API requests, and find out why a response went wrong. Replay calls, mock responses, and debug browsers, applications, and Android in one local workspace.
Available for Windows, Mac Apple Silicon, and Mac Intel.
See the exchange between your app and its API. Change one thing, send it again, and inspect the result.
Launch an isolated Chrome or Brave window, connect a proxy-aware client, or choose an Android device. Keep your capture focused on the source you want to understand.
Search by URL and filter by method or status. Read headers, cookies, JSON, and decoded Protobuf bodies, or inspect captured WebSocket messages.
GET/api/products200POST/api/session401GET/api/account200Send a captured request to the composer and change its method, headers, or body. Use an exact-URL response rule to reproduce a failure or test an edge case without changing your backend.
Sessions stay on your device. Export HAR or JSON when you need to share a reproducible example.
From API authentication to mobile requests, bring the details into a workspace you can search and inspect.
Follow a request from URL and headers to status code and response body. Find the payload or parameter behind an unexpected result.
Inspect authorization headers, cookies, and redirect responses in your test sessions to track down failed logins and expired tokens.
Choose an ADB-connected device and set up the companion VPN. View HTTP and supported HTTPS requests in the same desktop workspace.
Ask questions in AI chat or enable the authenticated, read-only MCP server for a compatible AI client to explore captured requests.
Keep local interception and add an upstream HTTP proxy, with optional credentials, to test requests through a different outbound IP.
Save captures on your device and export HAR or JSON. Share the requests and responses that explain the issue with your team.
WhiteInspect sits between a supported client and its destination so you can inspect the HTTP conversation.
Open an isolated browser from WhiteInspect or point a test client at the local proxy. For Android, connect a device over ADB and choose it in the app.
Isolated browsers are configured for capture. For other clients, export and trust the local CA. Android apps with certificate pinning need a compatible debug configuration.
Repeat the action that fails, find the request in View, and inspect its response. Replay it or mock a different result to narrow down the cause.
The Android 8+ companion routes device traffic to WhiteInspect through a VPN connection. Use it with the desktop app and approve certificate trust for supported HTTPS traffic.
Capture, certificates, Android, and choosing the right workflow.
WhiteInspect is a desktop HTTP debugger and interception proxy from WhiteSolutions. Capture HTTP and supported HTTPS traffic, inspect API requests and responses, replay requests, mock responses, and save sessions locally. An Android companion connects a test device to the desktop workspace.
If you need a workspace for HTTP capture, HTTPS inspection, API request replay, and response mocking, WhiteInspect covers those workflows. It also includes Android interception, an optional upstream proxy, and a local MCP server. Check the capture and certificate requirements for your client when choosing a debugging tool.
WhiteInspect uses a local certificate authority to inspect supported HTTPS connections. Isolated Chrome and Brave sessions are configured automatically. Other test clients need to trust the exported CA. Applications that pin certificates or reject user-installed CAs need a compatible debug configuration.
Yes. Connect an Android 8+ device with USB debugging enabled, choose it from the desktop app, and install the companion through ADB. Approve the VPN connection on the device and install the local CA for supported HTTPS traffic. The companion needs the desktop app; it is not a standalone traffic inspector.
Open a captured request in the composer, change its URL, method, headers, or text body, and send it again. For response mocking, create a rule that matches an exact URL and optionally an HTTP method, then choose the response status, content type, and body.
Yes. Add an upstream HTTP proxy in Settings using host:port or host:port:user:pass. WhiteInspect inspects the traffic locally and forwards it through your configured proxy. This lets you investigate requests using a separate outbound IP.
Enable the optional local MCP server to give a compatible AI client authenticated, read-only access to capture data. WhiteInspect also has an AI chat workspace. Captures are stored locally; data you choose to send to an external AI provider is handled by that provider.
Published installers are listed in the downloads section for Windows, Mac Apple Silicon, and Mac Intel. Platforms without a published installer show Coming soon. Android capture also requires the desktop app and its companion APK.